Social challenges brought by COVID-19

Coronavirus has changed the way we live and will bring numerous difficulties. Using data, we hope to shed some light on issues policymakers need to focus on most. We will modify this page with updated data and new analyses on a regular basis.

Social media

Reddit as the leading indicator

Scientific papers

COVID-19 Open Research Dataset, arXiv, and SSRN


News articles


We collected news articles from from the period 1 January 2020 - 30 June 2020.

Sources used: ArsTechnica, Euractiv, Fastcompany, Gizmodo, Guardian, IEEE, Politico.eu, Reuters, Techcrunch, Techforge, The Conversation, The Register, Verge, ZDNet

Trending terms in news articles


32 most trending COVID-19 keywords are identified

Based on the weekly changes in term frequencies, the most trending terms were identified. We grouped them into 4 wider areas: related to the health issues in the pandemic, social challenges, social distancing, and remote work. The size of the bubble is based on the regression coefficient. Bigger bubble: more robust trend.

Social distancing is not only an issue in the COVID-19 crisis, but also in technological matters: using new technologies, we may bring our quality of life closer to the pre-quarantine times, and possibly shorten the period of restrictions.

News top words


New crisis, old problems?

Analysing keywords gaining popularity in the tech media articles, we can see that COVID-19 crisis exacerbates many well-known social challenges, e.g. widely spread conspiracy theories and misinformation. Economic repercussions of the pandemic are discussed intensively, the focal points are reopening of the economy, unemployment, and remote work. Various apps designed for remote work and video chats have been extensively covered in the tech media. In recent weeks, with people getting used to COVID-19, other issues arise – like the Black Lives Matter movement.

Sentiment analysis


Apple-Google
PEPP-PT
Zoom
Disinformation
Ventilator

Apple Google: the positive paragraphs report on companies' joint effort to enable the use of Bluetooth technology and common API to help reduce the spread of the virus.

Neutral and slightly negative paragraphs focus on conspiracy theories related do COVID-19 tracing apps and privacy concerns related to certain apps regarding storing personal data on a central database or sharing data with third-party services.

Most positive Neutral
google-apple api conspiracy
decentralised protocol privacy concern
privacy preserving covidsafe app
trace app test positive
french government north dacota

PEPP-PT: news articles in the wake of pandemic reported extensively on various tech projects related to tracking the movement of infected individuals. PEPP-PT is a coalition of researchers and tech experts across Europe developing a common standard for contact tracing solutions. The sentiment in paragraphs covering PEPP-PT and other tech solutions have been positive or neutral, with negative sentiments only in case of a few terms (such as "mission creep").

A major angle of discussion is related to privacy and the fear of surveillance. Data protocols can be either "centralised" with data stored in a central location or "decentralised". Both approaches have advantages and disadvantages: in case of centralised systems more advanced data analysis is possible, but with a higher risk of data breach or violation of privacy. Various national governments initially opted for centralised solutions, while the choice led to conflicts within the PEPP-PT project with researchers leaving, including Marcel Salathé. Researchers preferring a decentralised data protocol published an own standard within the DP-3T project, an alternative for PEPP-PT. Additionally, when Google and Apple joined forces to prepare an API for decentralised contact-tracing, national governments needed to reconsider their strategies.

The identified co-occurring terms include various actors of the recent news around PEPP-PT: researchers (Fraunhofer Heinrich Hertz Institute, École polytechnique fédérale de Lausanne, Michael Veale from Digital Rights & Regulation at UCL, Mayank Varia from Boston University), companies (startup Arago with CEO Hans-Christian Boos, PocketCampus) the European Data Protection Supervisor Wojciech Wiewiórowski, government officials (Helge Braun), MEPs (Axel Voss) and worldwide contact-tracing projects (the TraceTogether app in Singapore, Aarogya Setu in India).

Most positive Neutral
Aarogya Setu Hans Christian
proximity-tracking Axel Voss
privacy first Pocket Campus
Fraunhofer decentralised model
Michael Veal Schweisshelm
Wiewiórowski said anonymised data
DP-3T phone-tracking
Lausanne Mayank
Helge Braun gps location
central server data-slurp

Zoom: the analysed paragraphs fall into positive or neutral sentiment. The text snippets with higher score include competing solutions, the use-cases during the pandemic and useful privacy preserving features (e.g. background changing). On the other hand, the paragraphs with the lowest scores present the security and privacy issues that were unraveled recently, such as “zoombombing”. With increased use of video chat solutions and higher scrutiny, competing app Houseparty also faced allegations related to security that were dismissed by the company (offering bounty to identify the source of the “commercial smear”).

Most positive Neutral
skype zoombombing
slack stamos
work remotely end-to-end
background trump
telehealth zuckerberg

Disinformation: the positive paragraphs include the efforts of social media platforms to tackle COVID-19 fake news. Commission Vice-President Věra Jourová who presented a communication on ‘Tackling COVID-19 disinformation’ is mentioned.

The most negative news include conspiracy theories about vaccines, and the role far-right political movements and media play in spreading disinformation.

Most positive Most negative
stamos fox news
snap vaccine
230 farright
jourova tweet
content moderation conspiracy theory

Ventilators: the positive fragments describe new mass-producible ventilators and inventions allowing multiple patients using single ventilator.

The slightly negative and neutral paragraphs report on the struggles in the US to mitigate the ventilator shortage. They describe America's car factories shifting to make ventilators and other medical equipment to help combat the coronavirus pandemic.

Most positive Most negative
virgin orbit governor
face shield fremont
nhs fauci
petersen chloroquine
recovery trump

Changing opinions

The sentiment analysis resulted in a compound score for every paragraph containing a given phrase. The score is calculated from the mean of the valence scores of each word in the paragraph apart from the analysed words themselves, which have been removed from the paragraph's text.

Two methods are combined to:

  • Find the words that appear frequently together (“co-occurrence analysis”) in the same paragraph

  • Examine the sentiment of paragraphs containing the co-occurring word pairs and find the most positive/negative ones

Sentiment analysis measures if a text is using rather positive, neutral or negative expressions. For each paragraph, a compound score was calculated, with range between +1 (extremely positive) and -1 (extremely negative).

Grouping articles based on topic


Next, we mapped articles based on their topic using a process called topic modelling. Topic modelling assumes that each article is a mixture of topics, and each topic is a collection of characteristic terms. Implementing an algorithm called Latent Dirichlet Allocation (LDA), 10 topics were assigned to the articles. However, the vocabulary of news articles is not static, but changes over time. In order to examine trends, we used the dynamic topic modelling (DTM) approach, where the vocabulary of each topic evolves with time. The dataset was divided into samples, containing articles from every two weeks. As an example, you can explore the most characteristic words for the topics based on articles published in the last two weeks of June. The size of the bubbles corresponds to the size of the topic: Topic 1 (climate issues with low lambda metric, stopwords with lambda close to 1) is the most frequently appearing topic in the documents, while Topic 10 (gaming) is the smallest. The location suggests how similar the various topics are to each other: e.g. Topic 7 (US handling of the pandemic) is in the same part of the graph as Topic 9 (American companies), while Topic 3 (business in general) is further away on the graph – but separate from all other topics. For each topic, the bars represent the individual terms that are characteristic for the currently selected topic. By adjusting the slider, you can view less frequent words that appear only in the given topic. For more information on LDA, see our blog post.

Evolution of topics


News change rapidly, with terms disappearing and new ones entering public discussion. Performing LDA on each sample, we examined how the probability of various terms changed over time. We focused on three highly relevant topics: healthcare system, contact tracing, and apps for meetings. First, news coverage focused on testing capabilities and lack of ventilators. In late April and May, authors switched to mitigation methods, like contact tracing, which is connected to privacy issues. The Zoom app experienced an increase in coverage up to May, at the beginning related to switch to remote work, later to privacy and security concerns.

Mapping articles


Next, we mapped articles in space based on their topic. In this exercise, we focused on articles that contained any of the terms in root form: "coronavirus", "covid-19" or "contact tracing". We combined two methods: LDA and t-SNE. With LDA, each article was assigned to a dominant topic which is revealed by the color on the map. To dive deeper, articles using similar vocabulary were assigned to each other using t-SNE. On the map, articles covering the same subject are neighbours: clear clusters are formed around such detailed topics as contact tracing, robots and Zoom. In the interactive version of the map, you can explore the titles of the articles. For more information on t-SNE, visit our blog post.

Click on the image to see an interactive version (4 MB)

Face masks


Masks have been a contentious topic. Early during the pandemic, WHO recommendations suggested that healthy people should not wear masks. Defying WHO's non-binding ordinances, countries like Czech Republic have made it obligatory for citizens to wear masks in public. How did the discussion develop?

Exponential increase in number of submissions

The topic was sharply increasing in popularity until early April. Peaks can be attributed to Czech response: both the social encouragement and government response (see timeline below). Clearly, European countries can be world leaders in implementation, and well-applied principle of subsidiarity enables comparison of various approaches, while not discouraging cooperation.

All days are consistent with UTC time, as they will be throughout whole analysis of Reddit.

A video has been posted about wearing masks, kickstarting a national and then European/international movement. A Czech journalist and author argues for wearing masks even by healthy people

Roušky a kritické myšlení #RouškyVšem

Czech Republic's 🇨🇿 government introduces a regulation making it compulsory to wear masks in public

Polish minister of health argues in media against wearing masks by ordinary citizens

Austria 🇦🇹 makes wearing masks compulsory in supermarkets

Poland 🇵🇱 announces that wearing a mask will be compulsory in public from 16 April

Austria 🇦🇹 starts lifting restrictions and maintains a decreasing number of new cases

Germany 🇩🇪 makes wearing masks compulsory in public transport and shops

Czech Republic 🇨🇿 begins another phase of easing lockdown, including driving schools and gyms

France 🇫🇷 makes wearing masks compulsory after emerging from lockdown

United Kingdom 🇬🇧 makes wearing masks compulsory in public transport and announces that the rule will soon be extended to supermarkets

Formula 1 season begins with Austrian 🇦🇹 Grand Prix under strict sanitary regulations, including mandatory mask-wearing

Donald Trump 🇺🇸 urged Americans to wear masks amid the second wave of the pandemic

Mental health


Economic uncertainty and health worries put a strain on mental health.

Number of comments in r/anxiety subreddit, 7-day moving average

Number of comments in r/depression subreddit, 7-day moving average

Number of comments in r/SuicideWatch subreddit, 7-day moving average


Anxiety and threat of suicides

Users of the r/anxiety subreddit in March posted almost twice as many comments on the subreddit daily as in the pre-quarantine period. The trend seems to be reversing, but it has not gone back to the levels from the beginning of the year. Interestingly, subreddits like r/depression experienced a decrease in activity – the opposite of r/anxiety. Worryingly, r/SuicideWatch picked up activity after a fall in March. Theoretical knowledge of psychologists can be combined with real-time data to encourage politicians to make correct decisions and communicate them well: in a more calm or decisive way, depending on social needs.

Job market


Economy is a complex and interconnected system. Hospitality and tourism industries have been hit first, but no sector is fully safe from the effects of coronavirus.
The crisis can be a part of a creative destruction process: we should hope to emerge stronger from it. Particularly, automation can be sped up: machines do not get sick.

7-day moving average of the number of comments. Words: unemployed, unemployment

7-day moving average of the number of comments. Words: automate automation, automated, digitalisation, robot, robots

7-day moving average of the number of submissions. Words: unemployed, unemployment

7-day moving average of the number of submissions. Words: automate automation, automated, digitalisation, robot, robots


Challenges and future developments

Reddit is mostly an American website, but despite different economic and social systems, insights can be drawn also for Europe, especially more developed countries.

Unemployment was at a low level, with the American economy recording record-breaking job creation. Immediately, however, millions of people got laid off, which became visible in social media even earlier than in official unemployment data (in this chart we did not include terms such as "fired" or "laid off"). Apart from the social and economic challenge, it created various technological problems as well: mainframe-based systems (as used in several US states) were not prepared for such a wave of new registrations.

Discussion about automation did not start growing until April, and the increases – both in the number of posts and comments – are way smaller than with unemployment or masks. Companies may forgo capital investments in times of quarantine. Nevertheless, the growth seems to be robust. Meanwhile, the role the governments may play is necessary to be discussed: does automation create too much short-run unemployment to be encouraged in the post-COVID economy? How do the long-term gains look like and how to ensure Europe's place as an automation frontrunner?

Comments with words: unemployed, unemployment. Top 16 subreddits

Related problems

As people get fired, they run into other problems. First and foremost, these belong to the legal and financial categories, and laid off workers look for advice in r/legaladvice and r/personalfinance. Other challenges which may appear are connected to relationships (r/relationship_advice) and mental health (r/depression).

Remote work


As the world has moved to remote work, tools making it possible have experience a surge of popularity, but they have not avoided setbacks.

Number of comments with term "zoom", 7-day moving average

Number of comments in with term "discord", 7-day moving average

Number of comments in with term "skype", 7-day moving average

Number of comments in with any of the terms relating to other remote work apps, 7-day moving average

Number of comments in with terms "remote job" or "remote work", 7-day moving average


Main apps

As an easy-to-use video conferencing app, Zoom has enjoyed increased popularity. It did not come without controversy, as Zoom routes some of its traffic by China – a country notable for industrial spying. The app has been called a "privacy disaster", and has falsely claimed to use end-to-end encryption. Nevertheless, its growth has been fairly stable and the number of comments regarding Zoom (regardless of context) is still much higher than before.

Understandably, some users began looking for alternatives. One such app is Discord. It has been commonly used in the gaming community for years. Students in multiple schools suggested this solution to teachers, who supported the idea. Skype (with usage mainly confined to the online sex industry) and other apps have now stabilized on a level comparable with January and February 2020.

Average sentiment of comments with the term "remote job" or "remote work", 7-day moving average

Comments with terms "remote job" or "remote work". Top 16 subreddits


Positive assessment of remote work

Using vaderSentiment, which is a dictionary-based method for analysing sentiments of texts, we computed a sentiment for each comment and averaged sentiments of all comments written in a particular day.

The sentiment of remote work has been significantly positive in the whole analysed period. It dropped in mid-March, when the peak frequency occured, but then grew to values close to 0.4 at a higher and stable frequency. Sudden change to remote work may have surprised people, but they seem to enjoy the new kind of normality. Will they return to offices when the pandemic ends? Offices may be regarded as dangerous: crowded offices are hotbeds for viruses.

Contact tracing


Multiple countries have announced that they are creating apps meant for tracking citizens exposed to coronavirus. South Korea monitors quarantined users, and Singapore has been the frontrunner in using Bluetooth technology. Bluetooth has also been implemented by the Czech Republic, as well as by the Apple-Google cooperation, which has released a public API and Bluetooth/cryptography specifications.

Number of comments containing the name of the country which has created a tracking app and the term "tracking" or "tracing"
divided by the number of subscribers to the country's largest subreddit, as a percentage

7-days moving average of number of comments containing name of any country with a tracking app and the term "tracking"


Countries with most discussion

Relative to the number of subscribers in the country's largest subreddit (not necessarily the obvious one: r/casualUK has more subscribers than r/UnitedKingdom), South Korea, Bahrain and Switzerland have generated most discussion about their tracking efforts. Bahrain's high position is caused by a low number of subscribers to the subreddit. Singapore – the model for many – is seventh, while United Kingdom is just behind the top eight. They both are in the top three with regards to the absolute number of comments, with only South Korea experiencing more tracking-related discussion.

The discussion on contact tracing in particular countries has significantly decreased in recent times. The Google-Apple cooperation has most likely moved the discussion away from particular countries.

Lockdown


Almost all leading world economies have been put into some kind of lockdown. The city of Wuhan and neighboring cities in the Hubei province have been the first on 23 January. Italy's lockdown started on 9 March. Lockdowns' impact on economy, containment of the virus, and social consequences have been discussed in media and on Reddit, especially in the wake of anti-lockdown protests in the United States.

Number of comments about lockdown protests

Number of comments about easing lockdown, 7-day moving average

Number of all comments with the word "lockdown", 7-day moving average


Comments with word: lockdown. Top 16 subreddits

Lockdown fatigue?

In mid-April, a wave of Republican protests in the United States demanded easing rules on lockdown. Some limited protests happened in Europe as cross-border workers disagreed with Polish quarantine rules.

Lockdown fatigue has been one reason why Sweden did not go into a full lockdown. Anders Tegnell's decisions resulted in a much higher death rate than in other Scandinavian countries to date, but the health care system has not been overcrowded and daily number of deaths reported recently is in low single digits. As a high percentage of Sweden's population may have already gained immunity, the spread is likely to stay low. Knowing the population's reaction for the first lockdown can improve efficacy if in autumn a return of restrictions is required.

Discussion on easing lockdown has been steadily increasing, although it is not as much of a topic as protests. It is connected to how people see lockdown: as an unpleasurable necessity, an infringement on their rights and an overreaction (like users of r/LockdownSkepticism), or a too-little-too-late measure?

Average sentiment of comments with the word "lockdown", 7-day moving average since early March

Changes in perception

The sentiment started from a level below 0: on average, comments were more negative than positive. As lockdowns were introduced in more and more places in March, the average sentiment value grew and stayed positive for whole April. As in early May the United States is easing its restrictions, users worried (correctly) it would result in a higher death toll, which made the average sentiment lower once again. During Black Lives Matter protests – which have not been related to the lockdown, but took place during a period of restrictions – the sentiment value has initially even dropped into negative values.

Open source


GitHub is the leading website for programmers to share their code. Now more than ever international cooperation has been required to tackle the crisis. Publishing code inspires other programmers and saves them work on solving the same problem once again. How fast have programmers reacted? What is Europe's place in the open source community?

Github repositories in time


The pandemic hit different regions in the world in various points in time. The open source community on GitHub has made attempts to explain the crisis and solve problems in a transparent way. We identified 15 countries with the largest current number of coronavirus-related repositories and checked the development of the number and activity of such repositories.

Run (1 second interval)
Run (400 milliseconds interval)

Virus hotspots

At the beginning of the pandemic, most repositories have been created in China. Italy, as the first-hit country in Europe had slightly more repositories created than other countries in Europe early on, but further developments made the UK, Germany, France and Spain overtake Italy.

Users from the United States and India have created the most repositories. American repositories are more forked and watched by other users than any other, and the most popular repository by far – Johns Hopkins University data – is from the United States. The low number of Chinese repositories does not have to be caused by overwork, lack of interest in open source or similar characteristics, but rather deleting existing repositories, possibly forced by the state: one of the most forked repositories, wuhan2020-timeline, has been deleted recently.

Daily number of coronavirus-related repositories created on GitHub


Open source rush is slowing down. What about activity?

In the wake of global pandemic the open source community rose to the challenge. Hundreds of projects aiming mostly at mapping and predicting the spread of the virus have been created each day since the pandemic outbreak. However, after an initial exponential growth we start to observe in the recent months a slowdown in the number of created repositories. Probably most ideas have already been proposed and the community has moved to a more stable phase of work on existing projects.

New commits added by week to GitHub repositories

New pull requests by week in GitHub repositories

New public forks by week of GitHub repositories


Stable number of commits

In spite of slowing down activity in creating new repositories, the number of commits per week stays rather high at about 100 thousand per week. A commit is often not comparable to another – various projects may have different requirements. The number of pull requests, used in projects with multiple branches has decreased even more, and the number of public forks is very low compared to peak.

Topics in introduction


What are these repositories about? Common themes must exist. Some users just fork an existing repository and adjust it to local conditions, others are inspired to create a similar – but improved – tool.

Wordcloud from words in GitHub's repository description

Number of occurrences of chosen words in GitHub repositories introduction

Web-based tracking solutions

Most repositories are concerned with visualization: tracking coronavirus, creating dashboards. A large number is analyzing and modeling using statistical tools, particularly for prediction. Is this work actually valuable? Epidemiologists have been created such models for decades, and yet another SIR model is unlikely to help. More data is required to assess the efficacy of crowd knowledge.

The most common topic as found by LDA (see below) was tracking coronavirus, particularly in India (which explains a large number of repositories). The second one was charts, often using web technologies. Topic 7 are the repositories which may have the largest positive impact, particularly X-ray scans, detection and classification of vulnerable patients.

Programming


There is a multitude of programming languages, with varying popularity and suitable for different applications. Main language of the repository can tell us what was likely to be the goal of the project. The number of forks or stars can identify projects people find most interesting.

Number of repositories with a given main language

Web development and data analysis

Main languages of repositories: JavaScript, HTML, TypeScript, CSS prove that webpages are a large part of development. Data analysis is done in Python or R, with repositiories using these languages ready for production use – Jupyter Notebook uses one of these languages (usually Python) as well, but its purpose is rather demonstrative in data science. Java has overtaken R in recent months, proving that the stage of development moves from pure data analysis to applications.

User / link to repository Distinct contributors 👀 Country Description Topics
1 CSSEGISandData 3453 23292 United States novel coronavirus (covid-19) cases, provided by jhu csse engineering, jhu, coronavirus, 2019-ncov, johns-hopkins-university, covid-19, systems-science, csse
2 covid19india 1428 4399 India tracking the impact of covid-19 in india analytics, covid19-india, tracker, visualization, covid19, covid-19
3 phildini 1116 466 United States a list of all the companies wfh or events changed because of covid-19 remote-work, static-site, covid19, covid-19
4 corona-warn-app 768 1720 Germany native android app using the apple/google exposure notification api. None
5 pcm-dpc 678 3361 Italy covid-19 italia - monitoraggio situazione gov, dpc, pcm, covid-19
6 tokyo-metropolitan-gov 655 5756 Japan 東京都 新型コロナウイルス感染症対策サイト / tokyo covid-19 task force website covid-19
7 corona-warn-app 548 1240 Germany native ios app using the exposure notification framework from apple. None
8 nytimes 470 5220 United States an ongoing repository of data on coronavirus cases and deaths in the u.s. covid-19
9 disease-sh 417 1999 api for current cases and more stuff about covid-19 and influenza postman, api, influenza, discord, disease, discord-server, cdc, redis, covid, corona, covid19
10 corona-warn-app 368 3266 Germany project overview, general documentation, and white papers. None
11 COVID19Tracking 336 33 repo for issues and administration None
12 covid19india 308 467 India our database csv, actions, database, json, covid, india, covid19
13 WorldHealthOrganization 303 1882 Switzerland covid-19 app coronavirus, firebase, epidemiology, flutter, covid-19, appengine-java, dart
14 soroushchehresa 240 1230 Iran 🦠 huge collection of useful projects and resources for covid-19 (2019 novel coronavirus) awesome-coronavirus, covid-19, awesome, covid19-data, awesome-corona, epidemiology, coronavirus-info, coronavirus, corona, covid19, 2019-ncov-data, 2019-ncov, awesome-list, sars-cov-2, 2019ncov
15 Path-Check 223 453 covid safe paths (based on private kit) is an open and privacy preserving system to use personal information to battle covid None
16 pomber 219 1079 Argentina json time-series of coronavirus cases (confirmed, deaths and recovered) per country - updated daily api, covid-19, coronavirus, json, data, 2019-ncov, time-series, dataset
17 neherlab 206 1296 Switzerland models of covid-19 outbreak trajectories and hospital demand outbreak, model, hospital, covid-19, open-source, opensource, coronavirus, population, simulation, neherlab, sars-cov-2, ncov, research, ventilator, science, modelling, covid, data
18 covidatlas 203 357 covid-19 coronavirus data scraped from government and curated data sources. scraping, coronavirus, covid-19
19 ExpDev07 195 1404 Norway 🦠 a simple and fast (< 200ms) api for tracking the global coronavirus (covid-19, sars-cov-2) outbreak. it's written in python using the 🔥 fastapi framework. supports multiple sources! coronavirus-tracker, fastapi, ncov, json-api, python3, covid19, api, rest-api, pipenv, heroku, pip, python, coronavirus, deaths, webapp, covid-19, coronavirus-real-time, recoveries
20 LAB-MI 184 533 service de génération de l'attestation de déplacement dérogatoire à présenter dans le cadre du confinement lié au virus covid-19 None
21 immuni-app 180 827 Italy official repository for the android version of the immuni application kotlin, mobile, mobile-app, covid19, android
22 Covid-19Radar 180 1601 open source / internationalization/ ios android cross platform contact tracing app by exposure notification framework xamarin app and server side code visual-studio, azure-cosmos, azure-devops, coronavirus, client-xamarin, ios-ibeacon, adobe-xd, exposure-notification, azure-functions, coronavirus-tracker, covid, bluetooth-low-energy, csharp, coronavirus-tracking, azure, covid-19
23 mathdroid 175 1066 Indonesia covid-19 global data (from jhu csse for now) as-a-service None
24 MohGovIL 175 483 Israel israel's ministry of health's covid-19 exposure prevention app covid-19, coronavirus
25 aatishb 159 281 tracking the growth of covid-19 cases worldwide vue, dataviz, plotly, covidtrends, covid, covid-19
26 COVID19Tracking 156 418 the covid tracking project website None
27 mrc-ide 155 1127 United Kingdom this is the covid-19 covidsim microsimulation model developed by the mrc centre for global infectious disease analysis hosted at imperial college, london. None
28 corona-warn-app 152 18 central repository to collect community feature requests and improvements None
29 BlankerL 147 1684 Hong Kong 2019新型冠状病毒疫情实时爬虫及api | covid-19/2019-ncov realtime infection crawler and api crawler, 2019-ncov, realtime-api
30 nychealth 145 648 United States None None
31 corona-warn-app 140 1551 backend implementation for the apple/google exposure notification api. None
32 turicas 137 435 Brazil dados diários mais recentes do coronavírus por município brasileiro None
33 someshkar 136 1028 India :microscope: covid19 india cluster graph coronavirus-tracking, covid19-cluster, covid19india, covid19-tracker, coronavirus, covid19-graph, covid19-india, covid19
34 alexgand 132 1603 python script to download all springer books released for free during the 2020 covid-19 quarantine None
35 ahertel 126 1047 a mac tool that finds available delivery slots for amazon's whole foods delivery and amazon fresh services scpt, notification, grocery-delivery, foods-delivery, amazon-fresh-services, coronavirus, delivery-slots, automation, amazon, script, mac, apple, applescript, delivery-window-finder, amazon-fresh, wholefoods, whole-foods
36 dsfsi 125 170 South Africa coronavirus covid-19 (2019-ncov) data repository and dashboard for south africa covid-data, data-science, covid19-data, south-africa, dataset, covid19, nicd, coronavirus, covid-19, dashboard, doi
37 openZH 124 328 Switzerland covid19 case numbers cantons of switzerland and principality of liechtenstein (fl). the data is updated at best once a day (times of collection and update may vary). start with the readme. None
38 JohnSundell 118 184 Poland a two-week effort to help support indie developers shipping apps on apple's platforms who have been financially impacted by the covid-19 pandemic. None
39 emergenzeHack 117 74 Italy condividiamo informazioni e segnalazioni sul covid19 civic-hacking, covid19, open-data, coronavirus, covid19-data, covid-19, covid-19-italy, civic-tech, opendata, covid-data
40 github 113 1022 United States a site that displays up to date covid-19 stats, powered by fastpages. data-science, covid19, analytics, data-visualisation, fastai, python, altair, pymc3, matplotlib, covid-19, fastpages, github-pages, papermill, jupyter, github-actions, nteract, covid-data
41 opencovid19-fr 112 250 France consolidation des données de sources officielles concernant l'épidémie de covid19 coronavirus, covid, covid-19, covid19-france
42 ahmadawais 111 1538 Canada 🦠 track the coronavirus disease (covid-19) in the command line. worldwide for all countries, for one country, and the us states. fast response time (< 100ms). https://nodecli.com coronavirus-real-time, corona, visualization, covid-19, coronavirus-analysis, coronavirus-info, coronavirus-tracking, coronavirus
43 MinCiencia 108 207 en formato estándar None
44 DP-3T 104 182 this is a covid-19 tracing client using the dp3t android sdk. None
45 corona-warn-app 102 416 corona-warn-app website None
46 nhsx 102 797 United Kingdom source code of the beta of the nhs covid-19 android app None
47 COVID-universities 101 19 open letter to university leaders None
48 google 99 1626 exposure notification reference server | covid-19 exposure notifications None
49 mhdhejazi 99 1203 coronavirus tracker app for ios & macos with maps & charts ios, coronavirus-tracking, swift, coronavirus, covid-19, coronavirus-tracker, macos-app, ios-app
50 owid 98 912 data on covid-19 (coronavirus) confirmed cases, deaths, and tests • all countries • updated daily by our world in data 2019-ncov, covid-19, covid, coronavirus
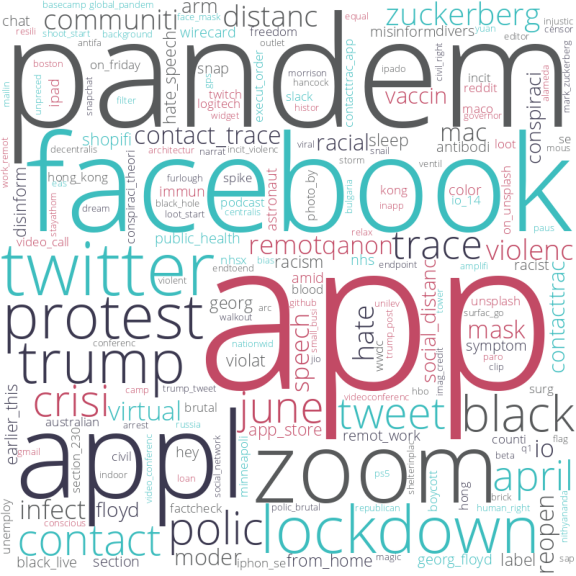
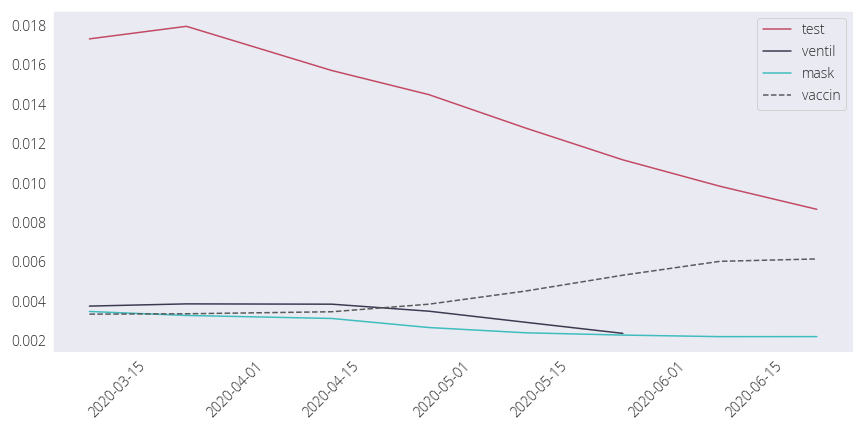
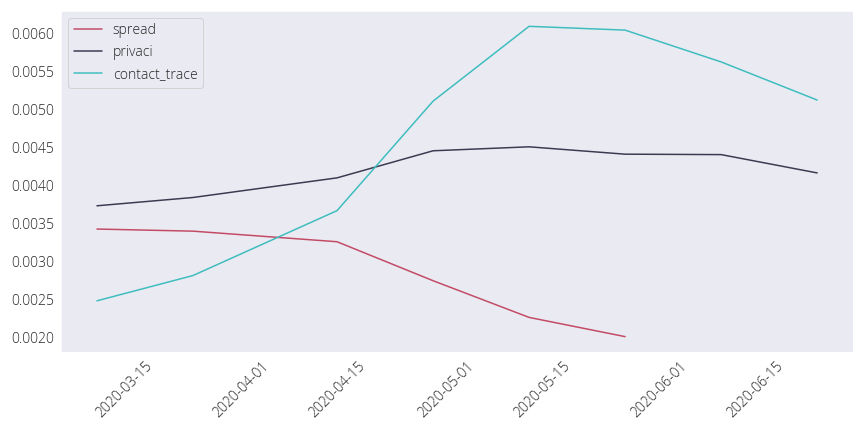
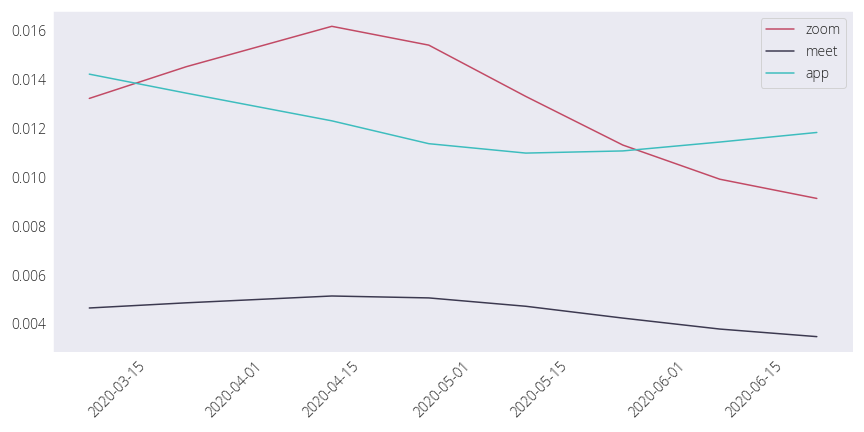
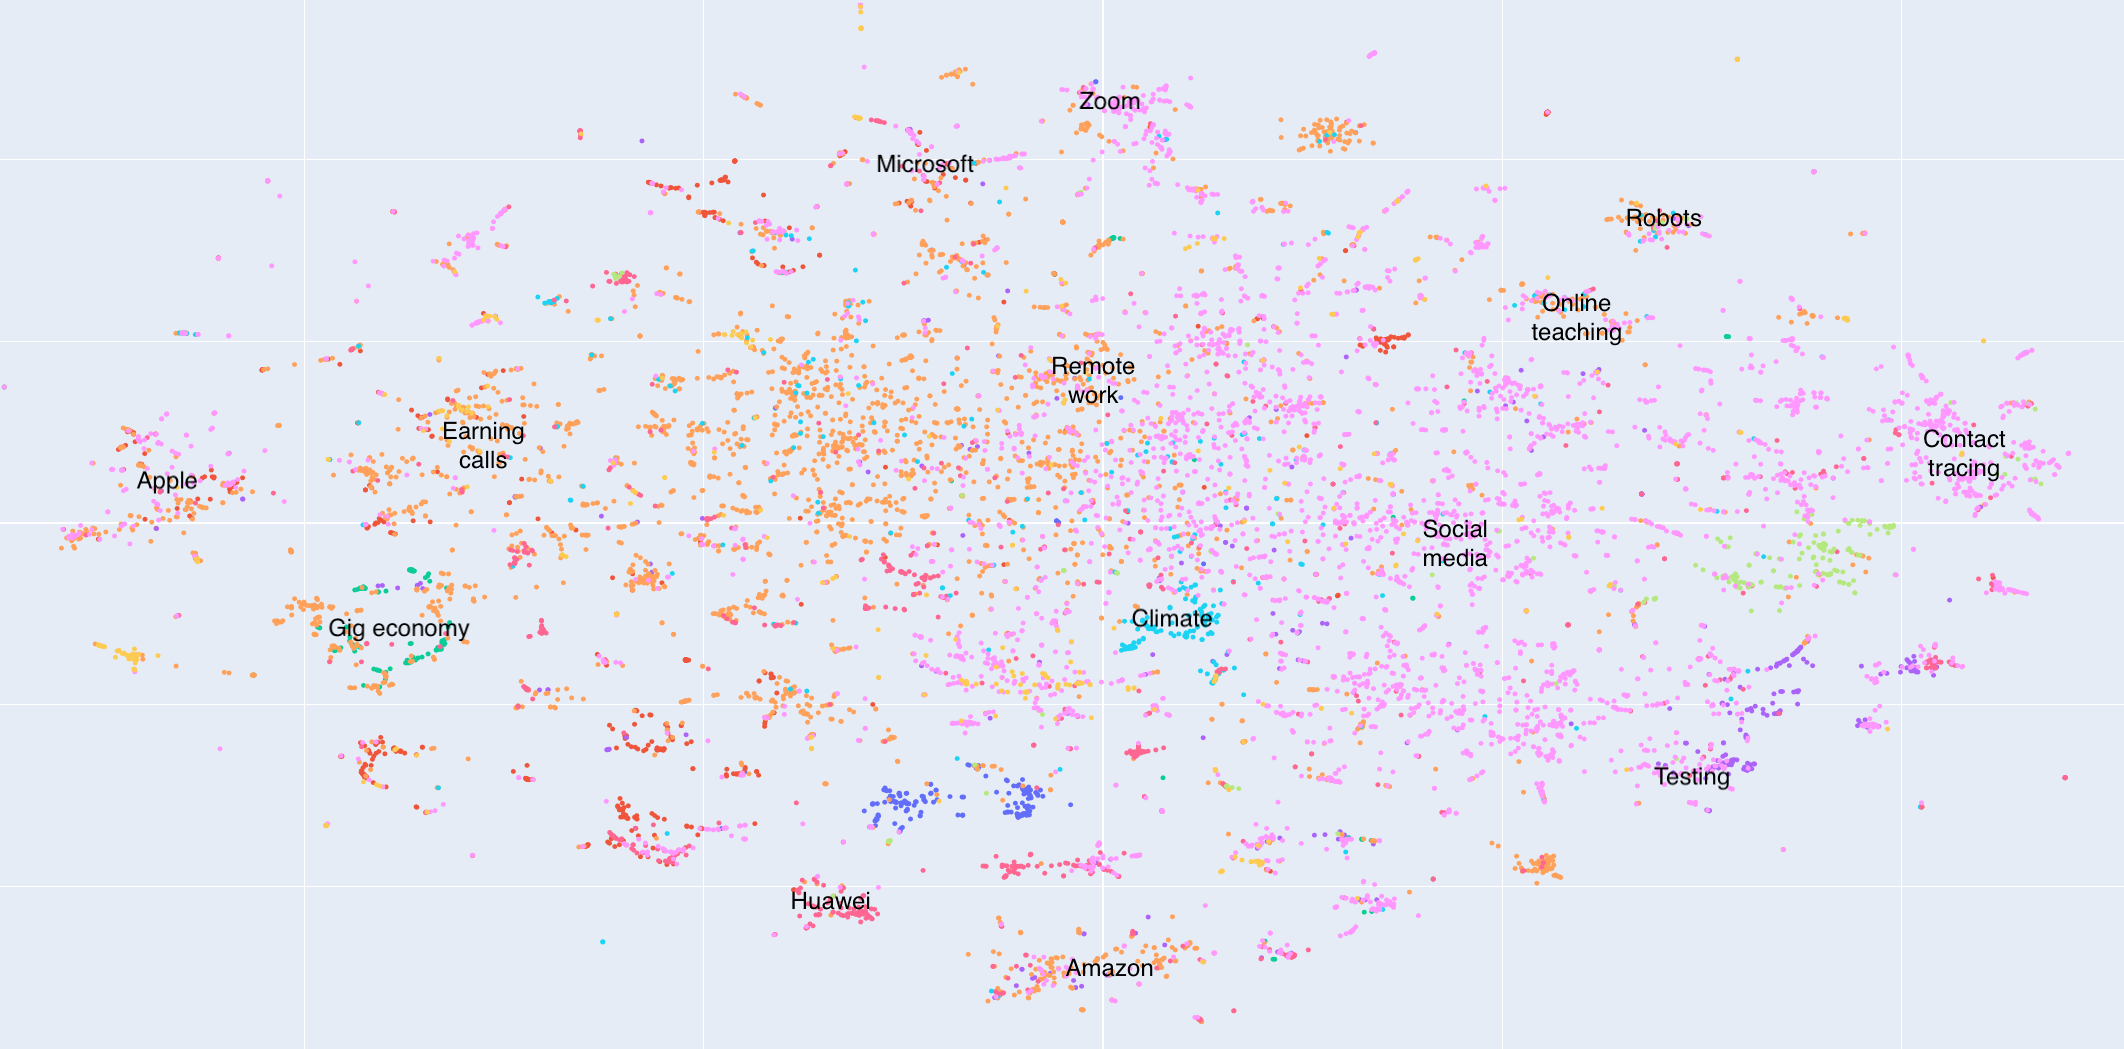
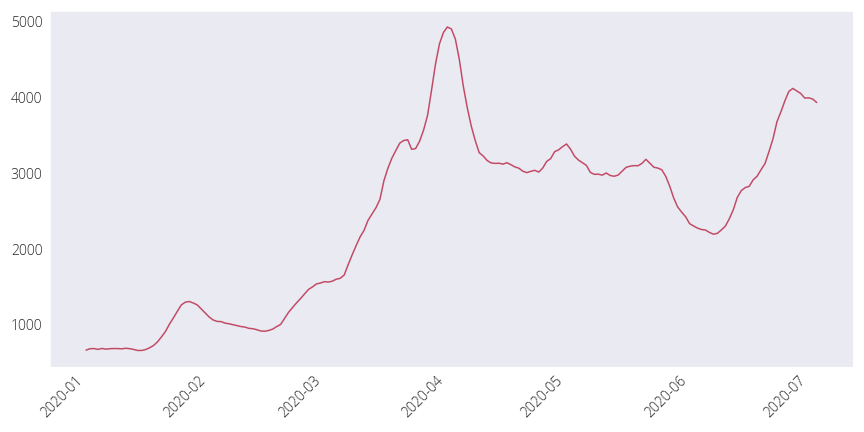
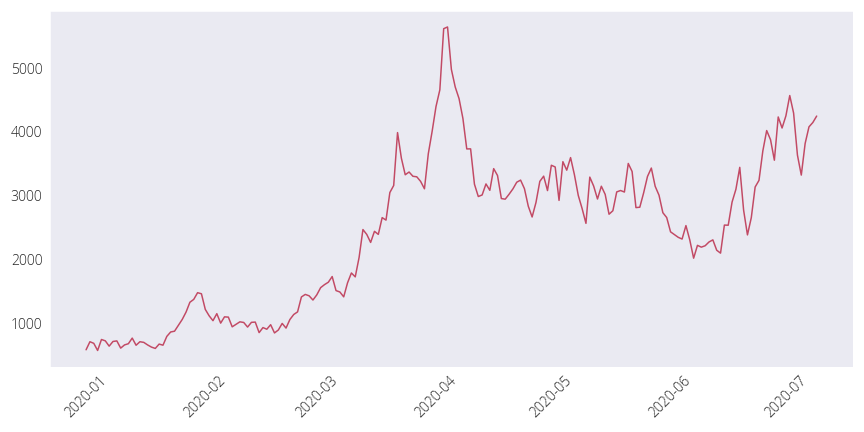
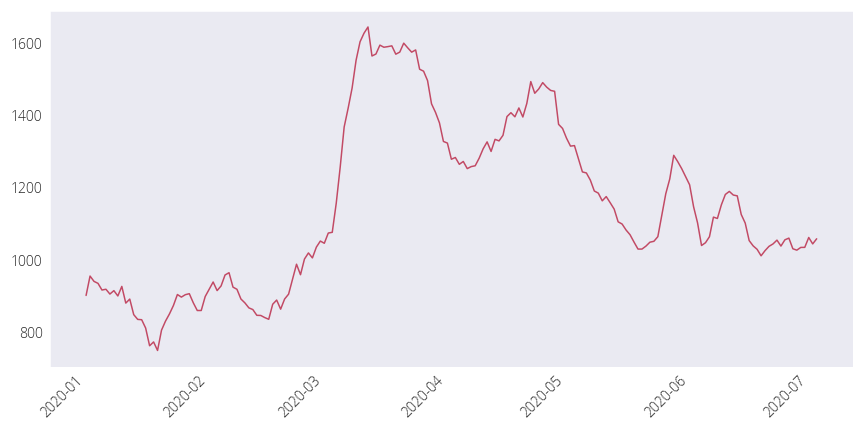
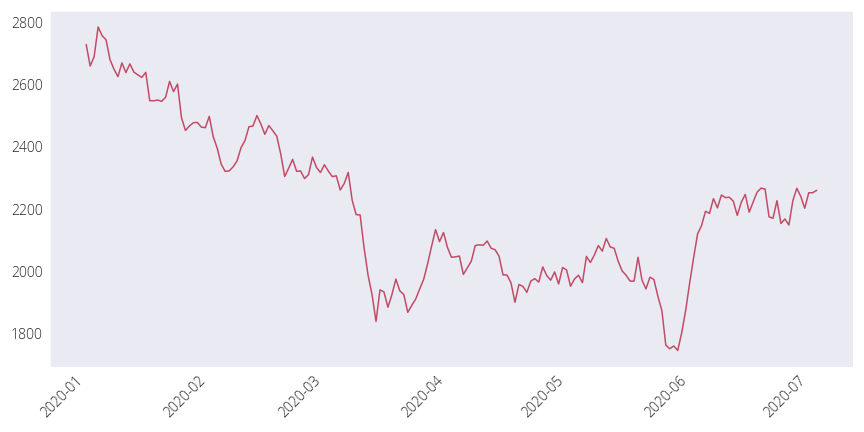
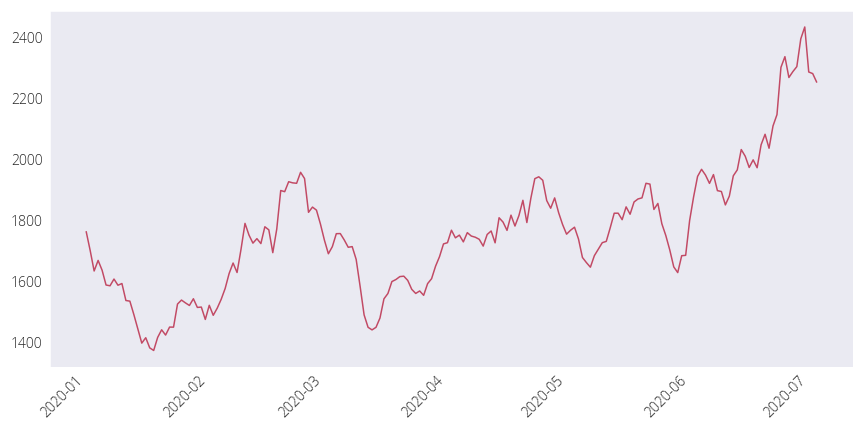
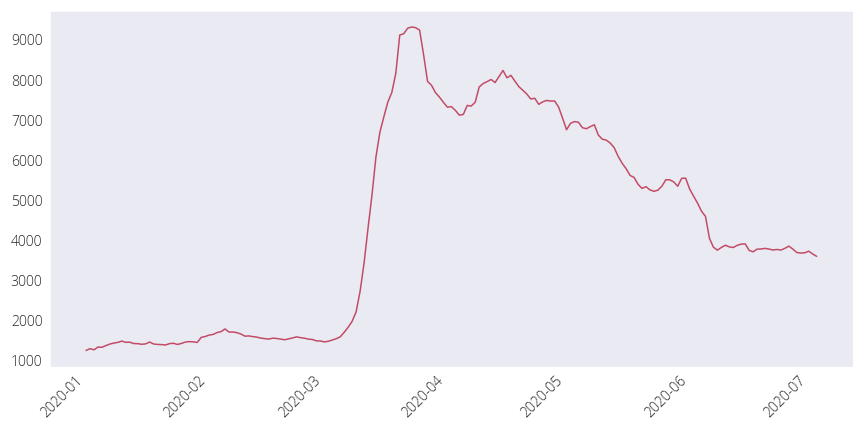
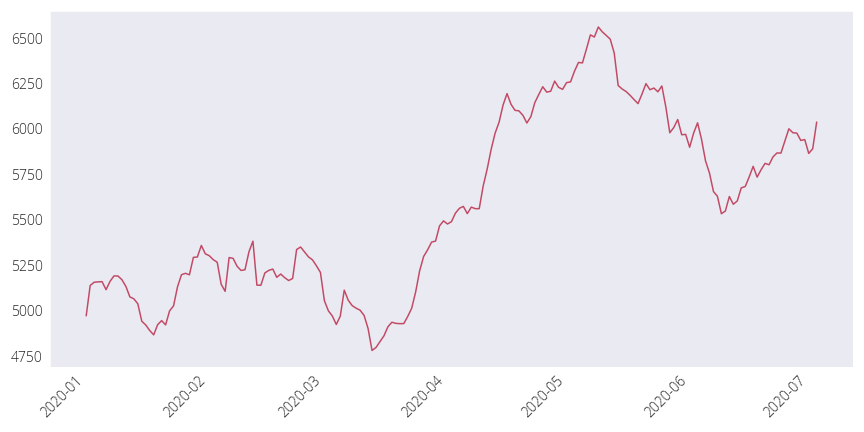
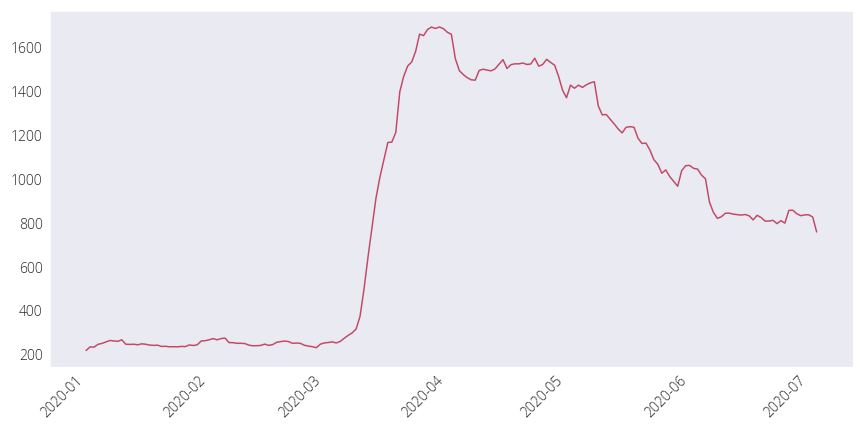
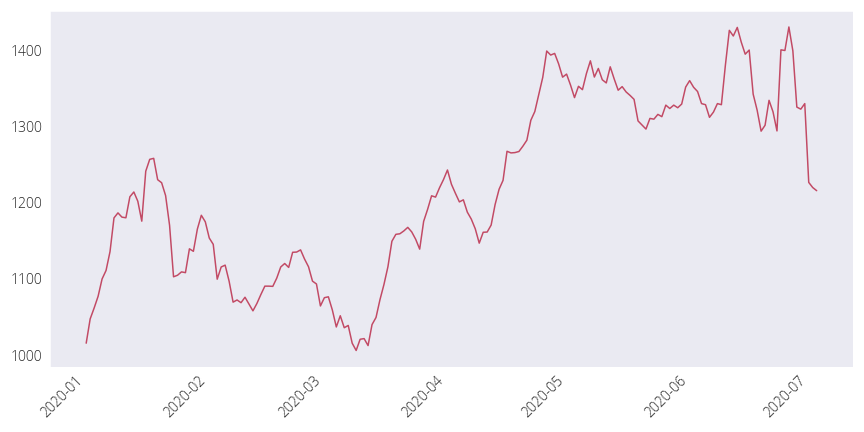
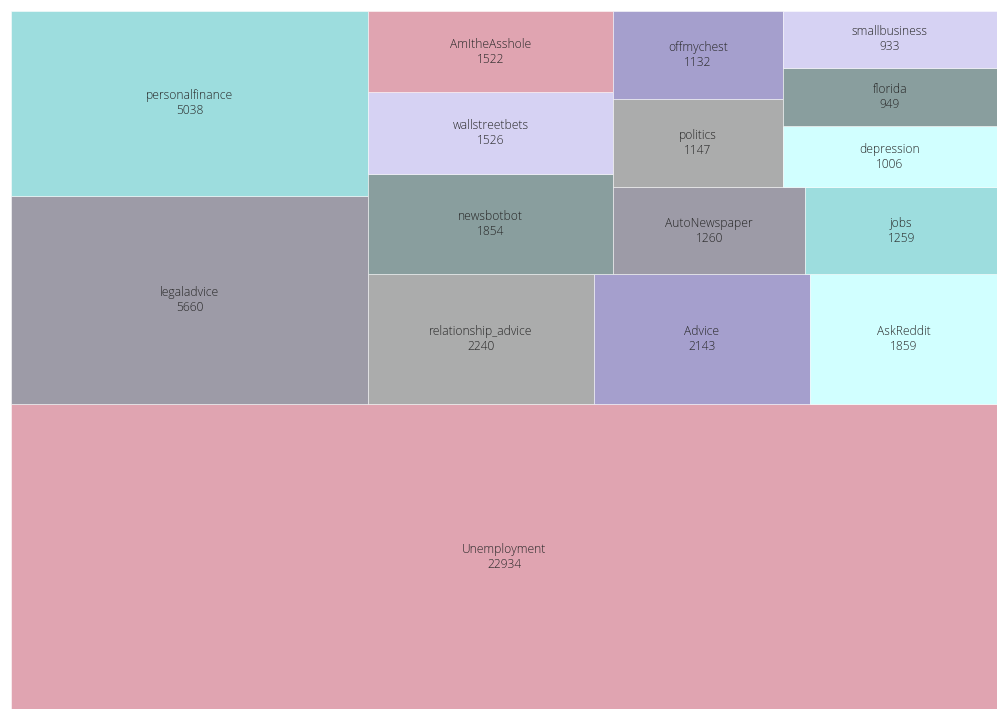
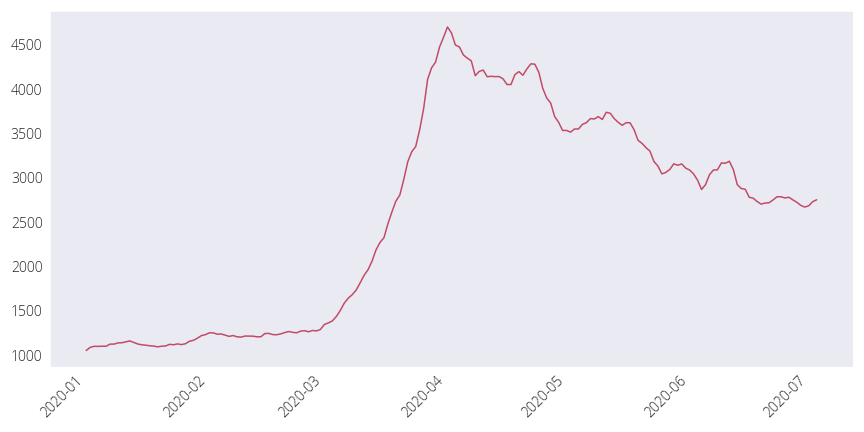
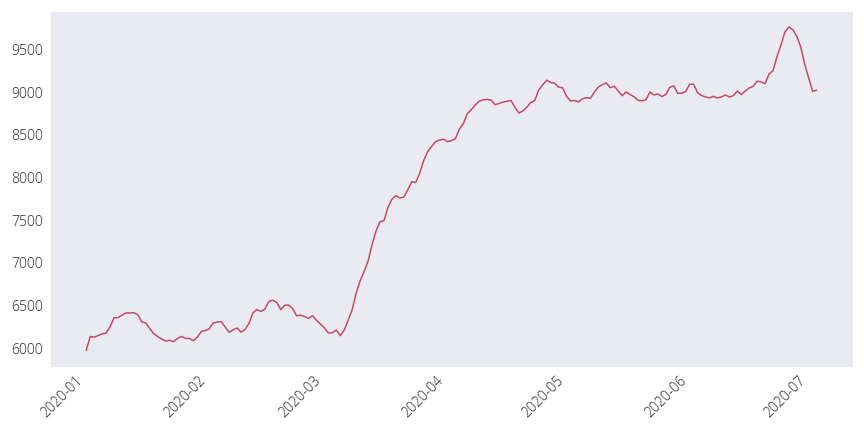
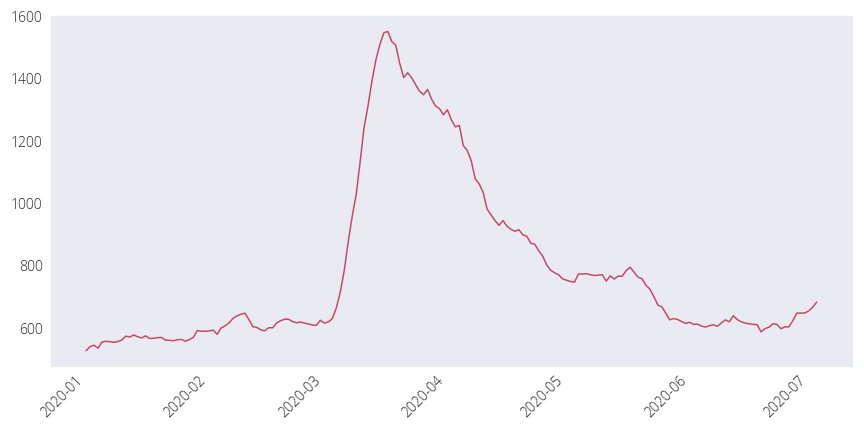
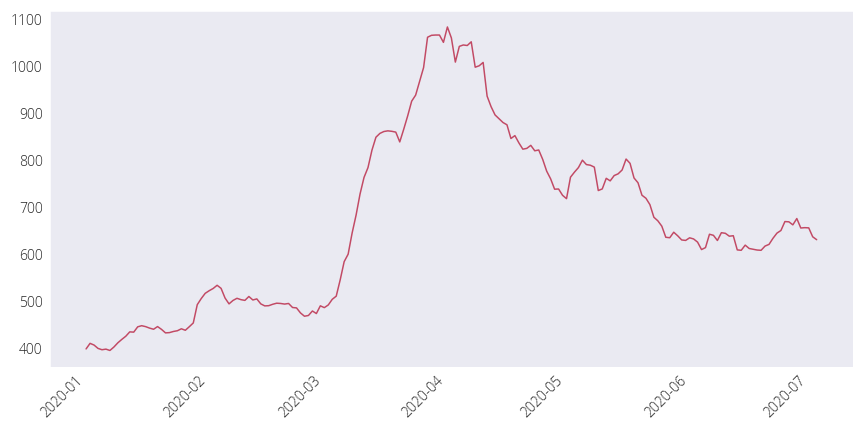
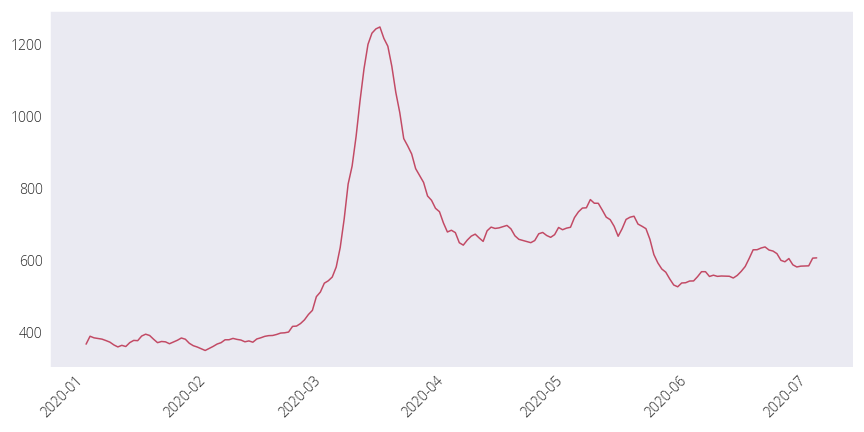
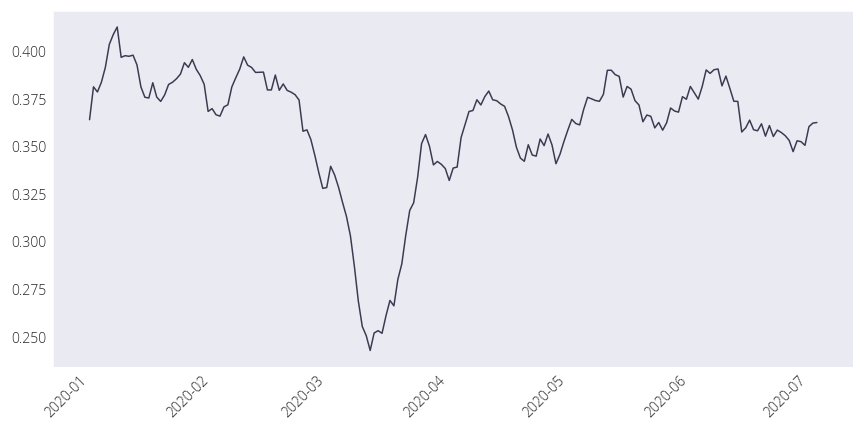
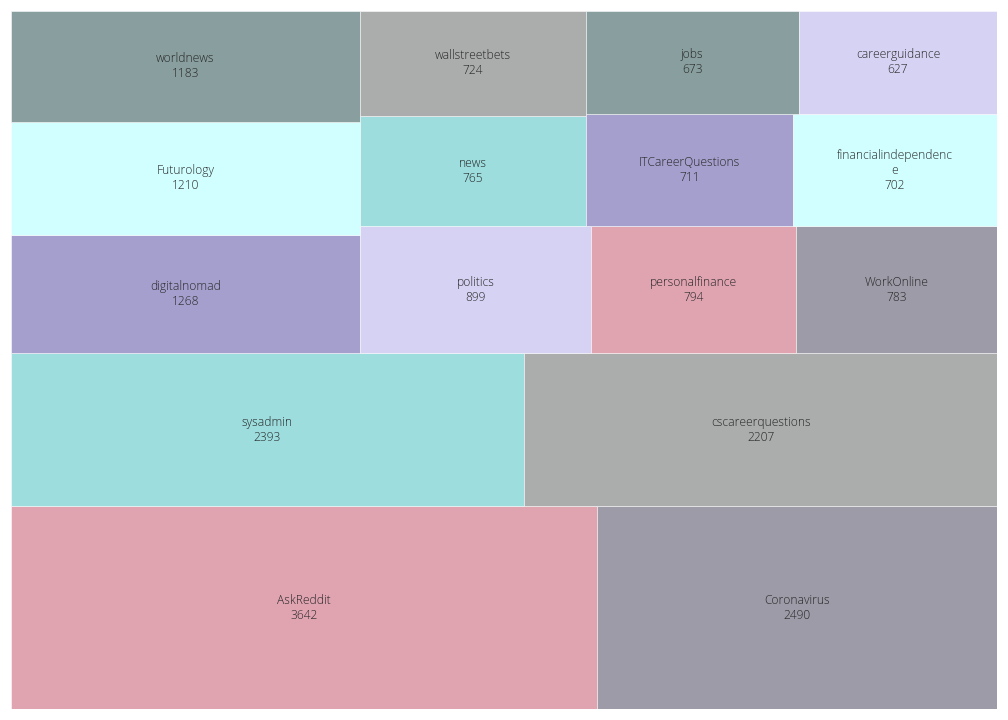
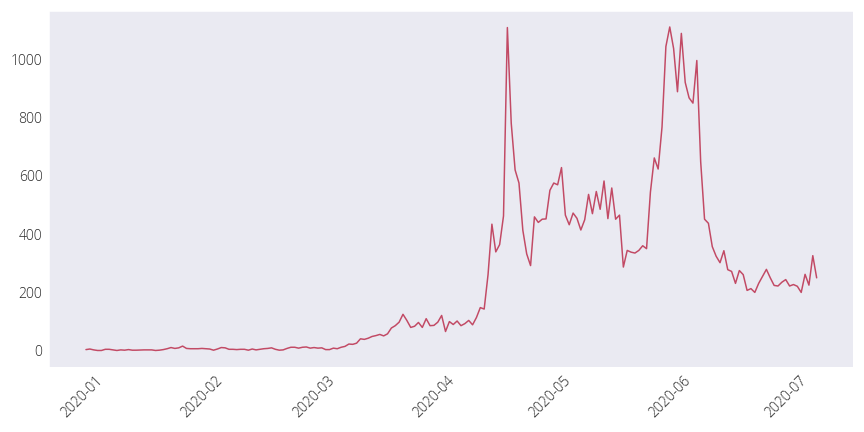
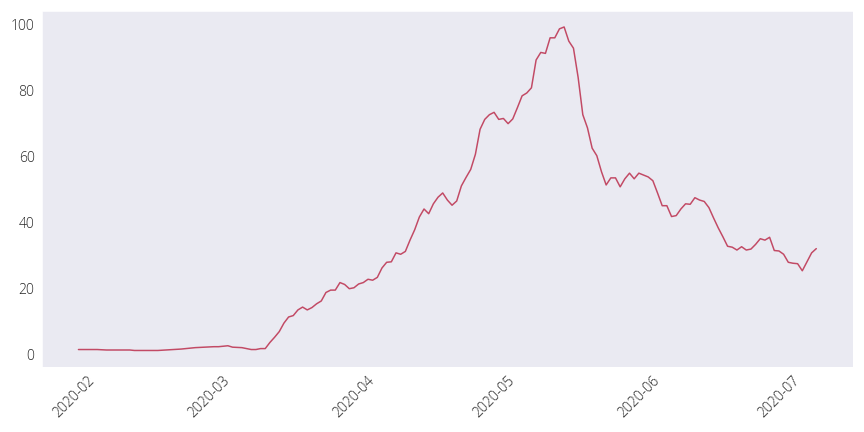
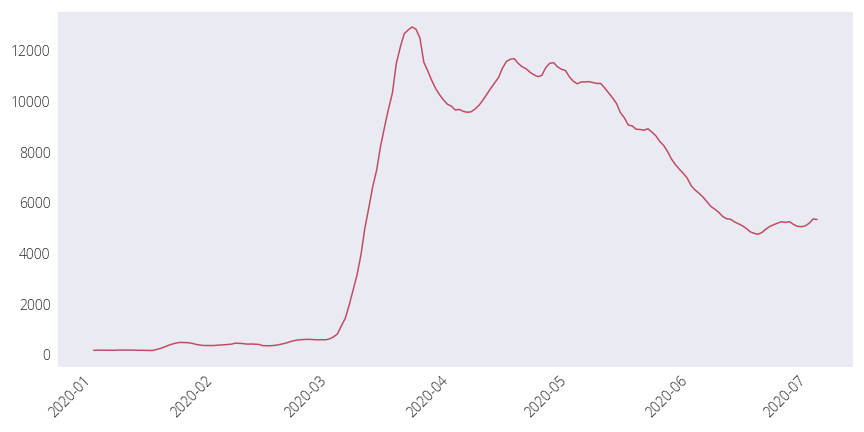
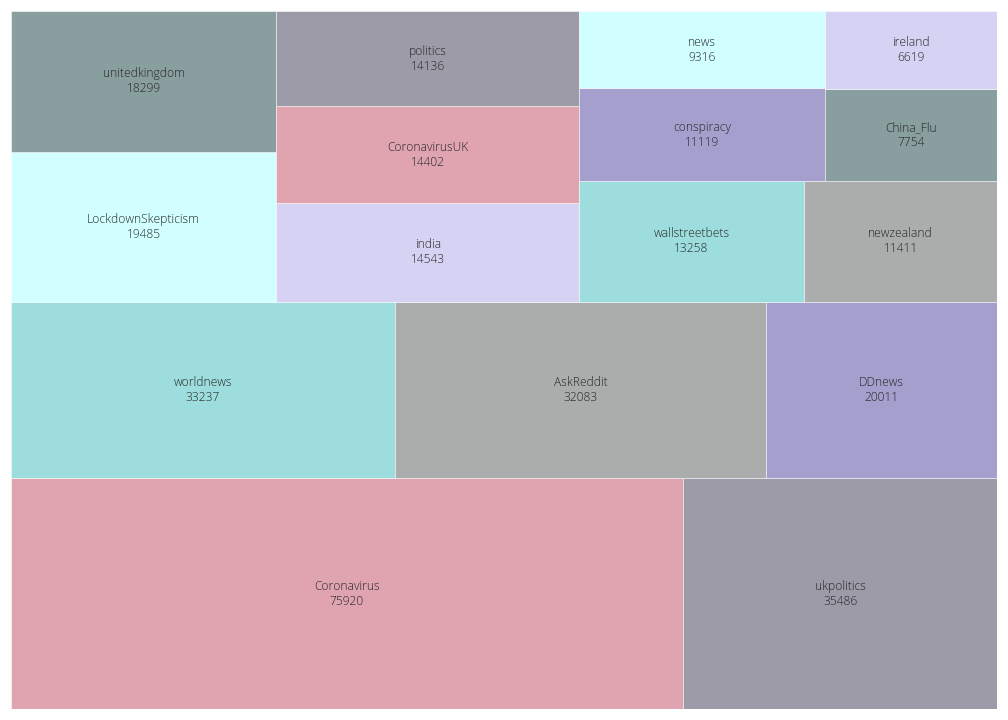
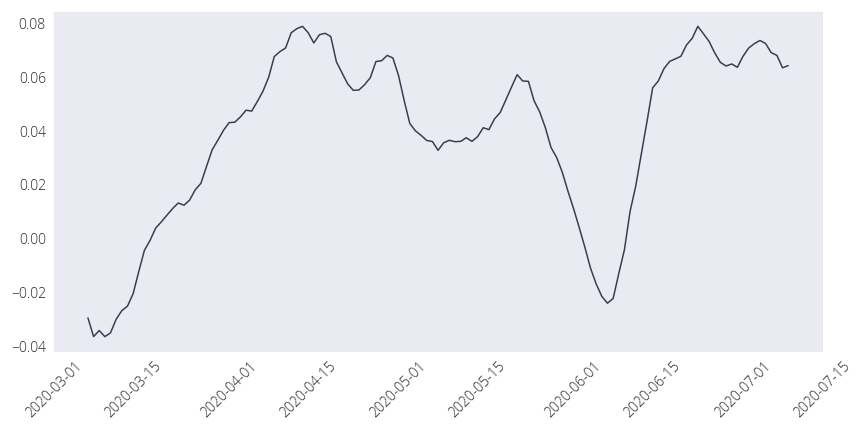
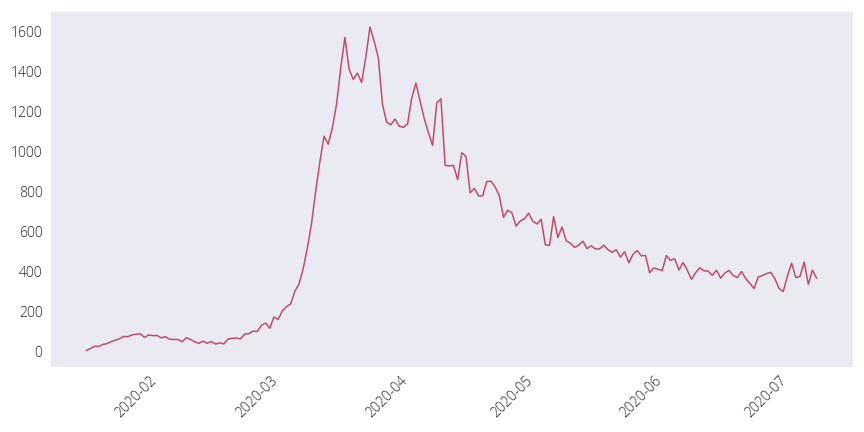
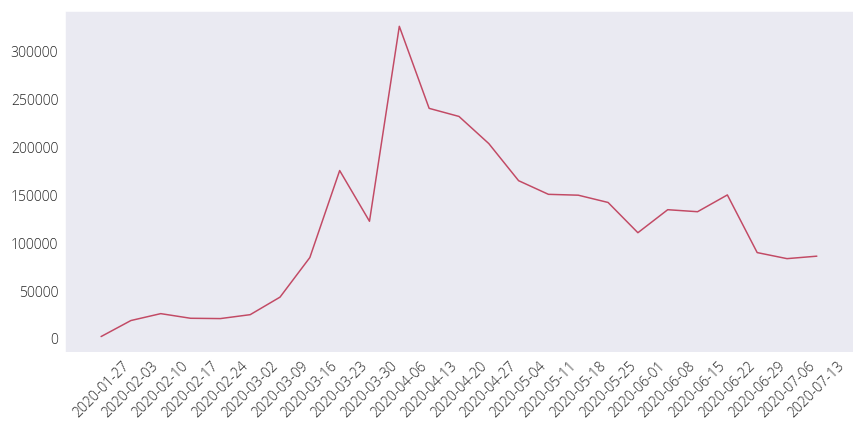
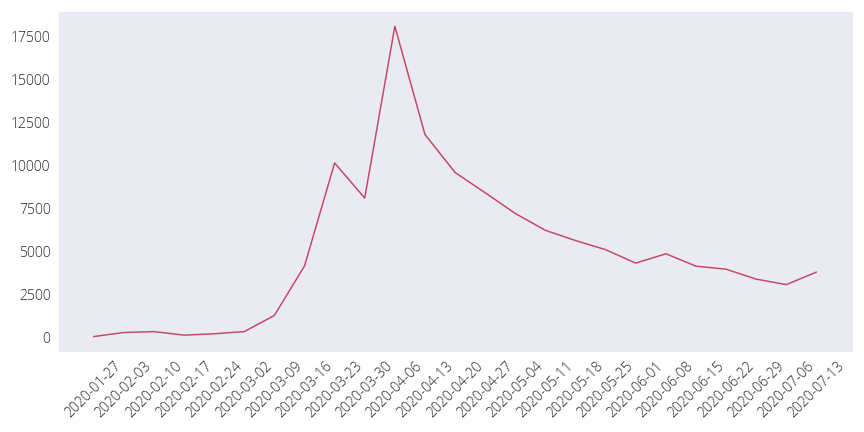
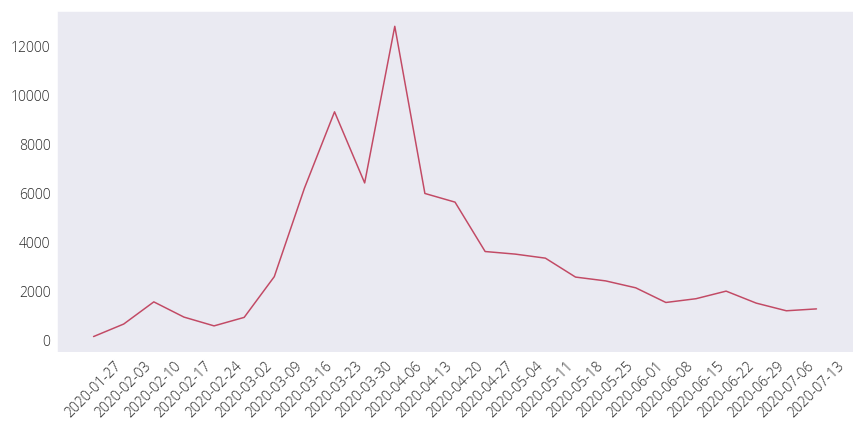
Scientific articles


In this part, a diverse set of sources has been used. arXiv abstracts show the state-of-the-art in physics, mathematics, computer science, quantitative biology etc. – all fields can contribute in some way to solving the pandemic-related issues. Social science articles from SSRN have been analysed to find the challenges the society faces, and the dataset from Kaggle has been used to show value of previous scientific research and the potential of European cooperation.

Science top words


Social, economic, and technical challenges

Most common trending words in the arXiv dataset, despite not limiting the analysis to coronavirus-related articles, are generally related to the pandemic. Contact tracing is the most-studied topic. Other research has not ceased to be published: self-supervised learning, language models, and recommendation systems are trending as well.

In dataset containing words from SSRN, a diverse set of problems can be identified, ranging from health-related (social distancing, incubation period, lockdown) to more common for social sciences: market, business or antitrust. Social sciences deliver a broader picture than news articles, which – even if focusing on social challenges – write rather about particular and immediate problems, such as small business closures or gig workers' plight.

Top countries and potential of cooperation


Research by country

Most papers did not have affiliations with countries available. In those which did, predictably USA and China lead in the scientific output. Alone, no European country is even remotely close to either of these two scientific superpowers. However, European Union's scientific output as a whole in the area of coronavirus exceeds the output of the leader in coronavirus research, China.


Project

NGI Forward has received funding from the European Union's Horizon 2020 research and innovation programme under the Grant Agreement no 825652. The content of this website does not represent the opinion of the European Union, and the European Union is not responsible for any use that might be made of such content.

Team

DELab UW is a transdisciplinary research institute established in 2014 within the University of Warsaw with the support of Google. Our lab serves as a platform for cooperation and the exchange of ideas between academia, business and public institutions.

  • Dobra 56/66, 00-312 Warszawa